What to Analyse
- pathfinderTop contributor
- Posts : 1450
Join date : 2014-02-23
Re: What to Analyse
First Guy wrote:path - please don't take it personal. It should be a debate on views and not people. it's not fighting people with tools or weapons but tools used and how you get to the final destination.
FG I don't take anything personal as this is not my FB page or a personal blog.
Glad to see you open your mouth,but you couldn't voice to appreciate a finding of a share which gave a 40% gain in very short period.Instead drag the topic somewhere else.This is called sucker effect.
This is the change of sentiment of members of SENTIMENT forum.way to go.

First Guy wrote:
You can go to a place by road or air. some not accessible by air and some not by road. sometimes it is quicker to go by road (short distance). But in most cases both are possible but time, cost, effort vary.
It's personal preference to use air or road,but Aeroplanes have no right to land on roads where poor people travel

Nothing PERSONAL FG

- pathfinderTop contributor
- Posts : 1450
Join date : 2014-02-23
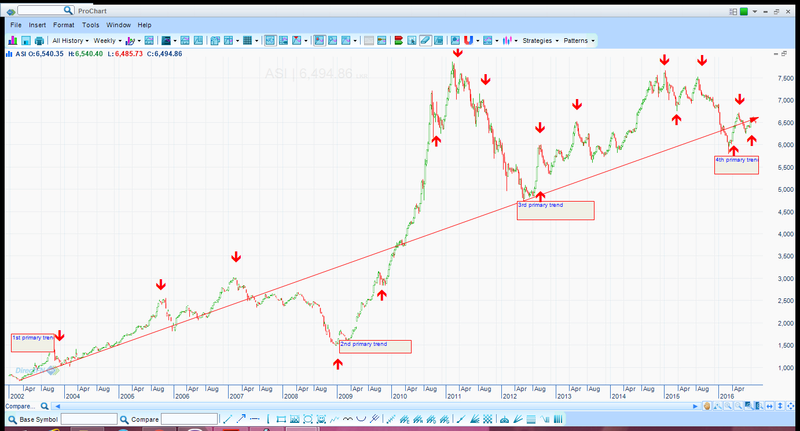
Longterm view of ASI
All these are publicly available data anyone can access.

As shown in the red trend line ASI is moving in a positive longterm direction since 2002.This is the longterm sentiment of investors.Once established it usually travel up to 25Yrs or more.So I expect to have this longterm positive sentiment till 2028-2030.
So longterm investors no need to have worry about there longterm positions till that.
During the longterm journy ASI had completed 3 primary trends.Marked in the chart.
Bull phase of 1st primary trend last about 5 and half years, bit higher duration than a normal trend.
Then it had bear phase waves till 61.8% fib retracement.
Then second primary trend started at December 2008.Bull phase had more than 2Yrs till Feb 2011 with few intermediate correction waves.
Then bear phase started and ended at July 2012.The value stands at 50% correction.
The 3rd primary trend started at July 2012.Bull phase ended at Jan 2015 with intermediate correction waves.Bear phase started there and ended at April 2016.Again 50% Fib level.Amazing isn't it.
If looked carefully there are small short term waves in all intermediate waves.
Now the fourth primary wave has started since April 2016. At the writing date what we are facing is a intermediate correction wave of a bull phase.
In summery
ASI is moving in a rather predictable pattern with average primary trends lasting 4-5yrs.
Each primary trend has bull phase about 2-3yrs.followed by rather short bear phase about 1.5-2Yrs.
Each bull and bear phase has interemediate waves and short term waves inside intermediate waves.
My conclusion,
ASI is on a longterm Bull phase.I expect it till 2028-2030
Now bull phase of the 4th primary trend has started.I expect it till 2018June -Sep,before next bear phase.
- Axe
- Posts : 251
Join date : 2014-02-23
Re: What to Analyse
- xmartTop contributor
- Posts : 732
Join date : 2015-01-17
Re: What to Analyse
Agree to the last drop.
Thanks
- blacknights
- Posts : 267
Join date : 2014-08-28
Re: What to Analyse
- HUNTERTop contributor
- Posts : 1935
Join date : 2014-07-14
Re: What to Analyse
When did you start to work on this line of thinking?
------
I also agree with the ideas of cycles and super cycles in the market and the concept of, market swinging around a long term trend line (or curve), as expressed in some of my posts in the past.
While, in them, arrived trend line would be slightly different (but not much) from that of yours.
- smallvilleTop contributor
- Posts : 1872
Join date : 2014-02-23
Location : Trying to figure out..
Re: What to Analyse

_________________
I take risks as a Trader and I select stocks based on Tech and daily Cash in/out. Therefore, my methods may not suit u.. so DYO analysis before making any decisions.
- roshana7549
- Posts : 280
Join date : 2014-04-18
Re: What to Analyse
- lanka
- Posts : 624
Join date : 2014-11-26
Re: What to Analyse
- yellow knifeTop contributor
- Posts : 6980
Join date : 2014-03-27
Re: What to Analyse
- pathfinderTop contributor
- Posts : 1450
Join date : 2014-02-23
Re: What to Analyse
HUNTER wrote:Good one path.
When did you start to work on this line of thinking?
I was saying this for longtime,but didn't go in to details.Infact I hinted downfall in Jan 2015 by saying the bull is Two years old,Can't remember the thread.
- First Guy
- Posts : 2599
Join date : 2014-02-22
Re: What to Analyse
- kollongaha
- Posts : 20
Join date : 2016-03-29
Re: What to Analyse
- Axe
- Posts : 251
Join date : 2014-02-23
Re: What to Analyse
Have you guys made similar observations?
- pathfinderTop contributor
- Posts : 1450
Join date : 2014-02-23
beginning of second intermediate trend
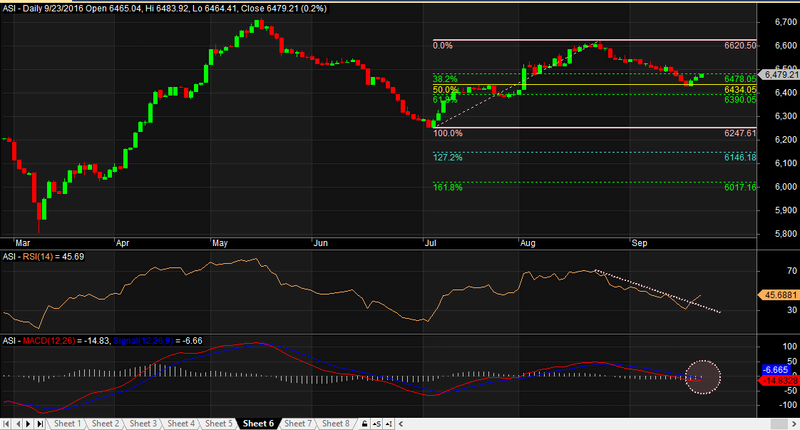
Following chart shows ASI movement with Fib levels.
RSI made a acute turn from oversold region and crossed the trend line.
MACD is about to make a turn, around "0" line.Once done it's a very bullish sign.
I expect ASI to move up from here to form the second intermediate trend of 4th primary trend I stated in earlier.

- Future123Active Member
- Posts : 1435
Join date : 2014-04-09
Re: What to Analyse
- The AlchemistTop contributor
- Posts : 651
Join date : 2014-02-25
Re: What to Analyse
- yellow knifeTop contributor
- Posts : 6980
Join date : 2014-03-27
Re: What to Analyse
- pathfinderTop contributor
- Posts : 1450
Join date : 2014-02-23
Poultry stocks

- yellow knifeTop contributor
- Posts : 6980
Join date : 2014-03-27
Re: What to Analyse
- pathfinderTop contributor
- Posts : 1450
Join date : 2014-02-23
few charts
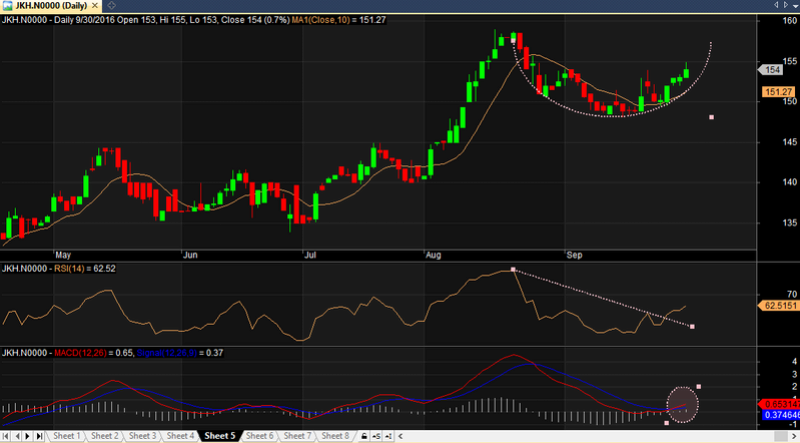
JKH,
JKH daily chart shows rounding bottom,Price line move above 10 day SMA,with RSI making a move above trend line,MACD crossing near 0 line.Technically JKH is a bullish counter.

- pathfinderTop contributor
- Posts : 1450
Join date : 2014-02-23
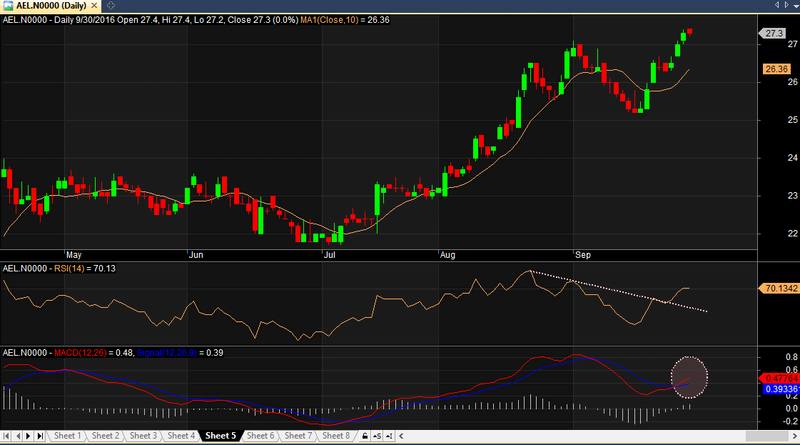
AEL chart
Price moving above 10 day SMA,RSI crossed trend line,MACD crossing.

- pathfinderTop contributor
- Posts : 1450
Join date : 2014-02-23
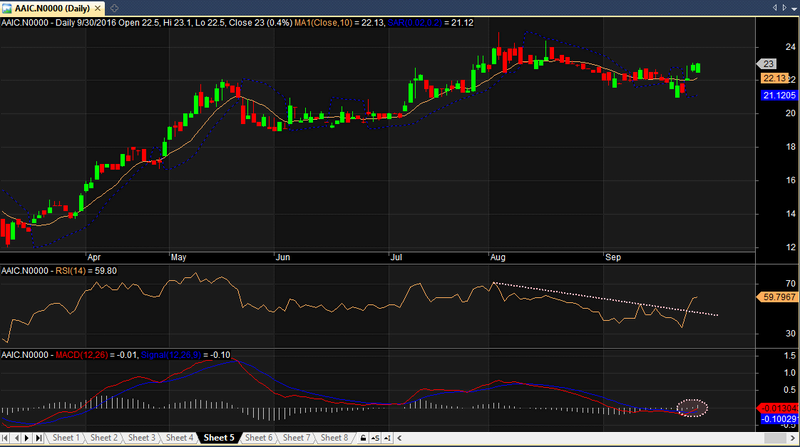
AAIC chart
PSAR down and price moving above 10 day SMA,RSI crossed trend line,A MACD crossing as well.