


http://www.marketwatch.com/story/bearish-divergence-is-warning-investors-not-to-buy-the-dip-in-the-stock-market-2015-09-04
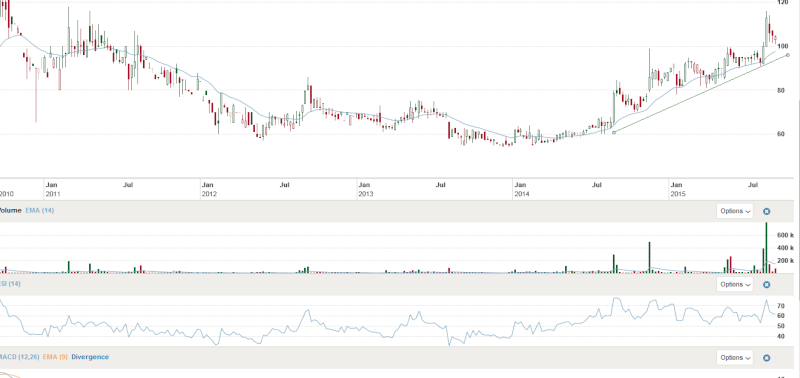
A chart signal that warns you not to buy can be just as useful as one that warns you it’s time to sell. Bearish divergences don’t necessarily suggest investors should sell, but they do warn that when a breakdown in price does occur, they should not fight it. The pattern now indicates the index could fall a lot further before the opposite “bullish divergence” appears.
A chart signal that warns you not to buy can be just as useful as one that warns you it’s time to sell. Bearish divergences don’t necessarily suggest investors should sell, but they do warn that when a breakdown in price does occur, they should not fight it. The pattern now indicates the index could fall a lot further before the opposite “bullish divergence” appears.


» CCS.N0000 ( Ceylon Cold Stores)
» Sri Lanka plans to allow tourists from August, no mandatory quarantine
» When Will It Be Safe To Invest In The Stock Market Again?
» Dividend Announcements
» MAINTENANCE NOTICE / නඩත්තු දැනුම්දීම
» ඩොලර් මිලියනයක මුදල් සම්මානයක් සහ “ෆීල්ඩ්ස් පදක්කම” පිළිගැනීම ප්රතික්ෂේප කළ ගණිතඥයා
» SEYB.N0000 (Seylan Bank PLC)
» Here's what blind prophet Baba Vanga predicted for 2016 and beyond: It's not good
» The Korean Way !
» In the Meantime Within Our Shores!
» What is Known as Dementia?
» SRI LANKA TELECOM PLC (SLTL.N0000)
» THE LANKA HOSPITALS CORPORATION PLC (LHCL.N0000)
» Equinox ( වසන්ත විෂුවය ) !
» COMB.N0000 (Commercial Bank of Ceylon PLC)
» REXP.N0000 (Richard Pieris Exports PLC)
» RICH.N0000 (Richard Pieris and Company PLC)
» Do You Have Computer Vision Syndrome?
» LAXAPANA BATTERIES PLC (LITE.N0000)
» What a Bank Run ?
» 104 Technical trading experiments by HUNTER
» GLAS.N0000 (Piramal Glass Ceylon PLC)
» Cboe Volatility Index
» AHPL.N0000
» TJL.N0000 (Tee Jey Lanka PLC.)
» CTBL.N0000 ( CEYLON TEA BROKERS PLC)
» COMMERCIAL DEVELOPMENT COMPANY PLC (COMD. N.0000))
» Bitcoin and Cryptocurrency
» CSD.N0000 (Seylan Developments PLC)
» PLC.N0000 (People's Leasing and Finance PLC)
» Bakery Products ?
» NTB.N0000 (Nations Trust Bank PLC)
» Going South
» When Seagulls Follow the Trawler
» Re-activating
» අපි තමයි හොඳටම කරේ !
» මේ අර් බුධය කිසිසේත්ම මා විසින් නිර්මාණය කල එකක් නොවේ
» SAMP.N0000 (Sampath Bank PLC)
» APLA.N0000 (ACL Plastics PLC)
» AVOID FALLING INTO ALLURING WEEKEND FAMILY PACKAGES.
» Banks, Finance & Insurance Sector Chart
» VPEL.N0000 (Vallibel Power Erathna PLC)
» DEADLY COCKTAIL OF ISLAND MENTALITY AND PARANOID PERSONALITY DISORDER MIX.
» WATA - Watawala
» KFP.N0000(Keels Food Products PLC)
» Capital Trust Broker in difficulty?
» IS PIRATING INTELLECTUAL PROPERTY A BOON OR BANE?
» What Industry Would You Choose to Focus?
» Should I Stick Around, or Should I Follow Others' Lead?