

ET I have the same doubt...anyway a technical chart like NCs is a must for this forum
Search
Latest topics
Disclaimer
Information posted in this forum are entirely of the respective members' personal views. The views posted on this open online forum of contributors do not constitute a recommendation buy or sell. The site nor the connected parties will be responsible for the posts posted on the forum and will take best possible action to remove any unlawful or inappropriate posts.
All rights to articles of value authored by members posted on the forum belong to the respective authors. Re-using without the consent of the authors is prohibited. Due credit with links to original source should be given when quoting content from the forum.
This is an educational portal and not one that gives recommendations. Please obtain investment advises from a Registered Investment Advisor through a stock broker
+40
yaka
knockknobbler
SalmantheGreat
chinwi
jiggysaurus
The Alchemist
slstock
pee ratio
Nitro 7
bugbee
SHARK
KDDND
stocks hunter
shane101
suja
Jana1
Seyon
yellow knife
oneshot
Leon
Hawk Eye
Nuinth
dhanurrox
Sriranga
cseinvestor
smallville
wmdcf
balapas
Backstage
Jimmy
girihell
pathfinder
serene
nihal123
Jana
Ethical Trader
sashimaal
Admin
First Guy
SHARK a.k.a TAH
44 posters
Harmonic Price Patterns

yellow knife- Top contributor

- Posts : 6980
Join date : 2014-03-27

NC`- Top contributor
- Posts : 163
Join date : 2014-09-27
Ethical trader and yellow knife, I'm not Shark... 
Talking about today, I'm not much happy with todays closing. Something has happened in between 13:54 -13:56. Someone has sold a big chunk at once.
However, there's a good point as well; it was a gap (according to my chart). Hope it'll fill the gap 2mrw, as it happens most in time.
And, ehh. even if 7040 is break, still more to go as its 50%. as 61.8% is waiting around 7000-6975.
There's around 80% possibility for a bull run, but who knows we'll have to wait and see....
NC`- Top contributor
- Posts : 163
Join date : 2014-09-27
and Pivot point is a good indication at these uncertain movements.
Weekly PP @ 7080 as I stated in early posts.
Weekly PP @ 7080 as I stated in early posts.
yellow knife- Top contributor
- Posts : 6980
Join date : 2014-03-27
Appreciate your efforts NC
Wether your predictions become real or not do stick to the way you predict.
We all understand that anything can happen between the cup and the lip
But the art of technical analyst should not change to grab uncertainty prevailing with politics
Wether your predictions become real or not do stick to the way you predict.
We all understand that anything can happen between the cup and the lip
But the art of technical analyst should not change to grab uncertainty prevailing with politics

Leon- Top contributor
- Posts : 1264
Join date : 2014-03-11
Nice work NC. + rep

chutiputha- Top contributor
- Posts : 1948
Join date : 2014-11-09
Age : 38
Location : SL
NC` wrote:and Pivot point is a good indication at these uncertain movements.
Weekly PP @ 7080 as I stated in early posts.
Thank U NC for ur Effort.Weldone.Hope u noticed that i also tried to get some output from Pivot Point and find Resistance,Supportive Levels of ACL,KCAB and AEL with help of PP and formulas.
2 Likes For U
https://forum.lankaninvestor.com/t2780p15-acl-kcab-and-apla-future#43271

Ethical Trader- Top contributor
- Posts : 5568
Join date : 2014-02-28
Thanks NC for the clarification.
NC`- Top contributor
- Posts : 163
Join date : 2014-09-27
Thanks and welcome u all.... 
NC`- Top contributor
- Posts : 163
Join date : 2014-09-27
Update of intraday ASI outlook:
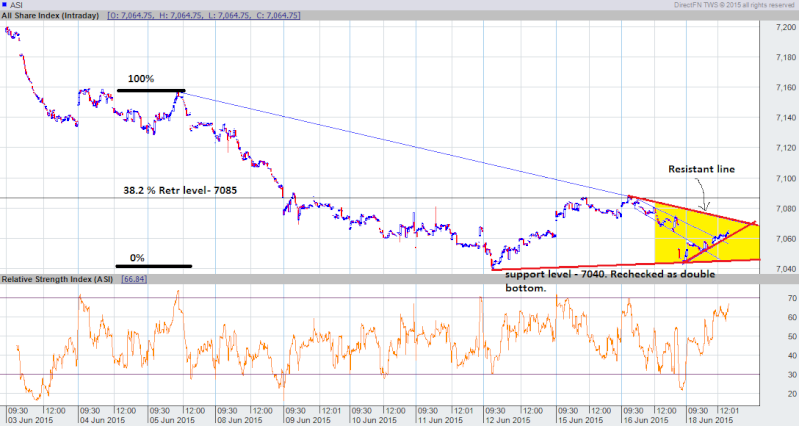
Market is weak than was expected. However, 7040 level is double checked now as support and worked well.
In the current context, market is ranging, its pulling and pushing by buyers and sellers, where's not much clear direction.
However, its being presuured to a certain direction as I've shown in yellow colour where it likely to move. Indeed its a wedge, but not symmetric, it more forced on downwards rather upwards.
Hence, its difficult to say which direction it'll take. And, I assume, Foreign buying or selling in coming days will give us the direction, or some political news..
chutiputha- Top contributor
- Posts : 1948
Join date : 2014-11-09
Age : 38
Location : SL
Thank U and Appreciate for ur effort. + NC

pathfinder- Top contributor
- Posts : 1450
Join date : 2014-02-23
Good one NC keep it up
Beaten down RSI is now coming up so the PSAR.For short term ASI may range between 7040-7300 creating good trading opportunities for early entrants.
Beaten down RSI is now coming up so the PSAR.For short term ASI may range between 7040-7300 creating good trading opportunities for early entrants.
NC`- Top contributor
- Posts : 163
Join date : 2014-09-27
Guys, I got a real problem in here, and I don't know how this chart "gilmart " happened... ?
Compare following two charts, which I post yesterday (18/06/15) around 1' o clock, and what they shows me on today. (19/06/15)
Yesterday, it was missing 17/06/15 ASI movement.. (the whole day).
This's what it shows me today..

How this has happened ? And its a misleading chart data, and we get misleading analysis/ result...
Compare following two charts, which I post yesterday (18/06/15) around 1' o clock, and what they shows me on today. (19/06/15)
Yesterday, it was missing 17/06/15 ASI movement.. (the whole day).
NC` wrote:Update of intraday ASI outlook:
Market is weak than was expected. However, 7040 level is double checked now as support and worked well.
In the current context, market is ranging, its pulling and pushing by buyers and sellers, where's not much clear direction.
However, its being presuured to a certain direction as I've shown in yellow colour where it likely to move. Indeed its a wedge, but not symmetric, it more forced on downwards rather upwards.
Hence, its difficult to say which direction it'll take. And, I assume, Foreign buying or selling in coming days will give us the direction, or some political news..
This's what it shows me today..
How this has happened ? And its a misleading chart data, and we get misleading analysis/ result...

Backstage- Top contributor
- Posts : 3803
Join date : 2014-02-24
pathfinder wrote:Good one NC keep it up
Beaten down RSI is now coming up so the PSAR.For short term ASI may range between 7040-7300 creating good trading opportunities for early entrants.
Since JKH subdivision is happening end of the month, I am expecting action up ahead. July, August will probably be painful months. I feel it would be good to take something off the table now , so that you could do some Averaging/bottom picking during election time..
serene- Top contributor
- Posts : 4850
Join date : 2014-02-26
Thanks NC.
Leon- Top contributor
- Posts : 1264
Join date : 2014-03-11
Backstage wrote:pathfinder wrote:Good one NC keep it up
Beaten down RSI is now coming up so the PSAR.For short term ASI may range between 7040-7300 creating good trading opportunities for early entrants.
Since JKH subdivision is happening end of the month, I am expecting action up ahead. July, August will probably be painful months. I feel it would be good to take something off the table now , so that you could do some Averaging/bottom picking during election time..
Yep yep, things to ponder.

smallville- Top contributor
- Posts : 1872
Join date : 2014-02-23
Location : Trying to figure out..
NC - Now U should understand why I dont DFN charts
I've seen Asha Phillip and CT both giving tech analysis and most of their charts serve a prime purpose.. That is; what they want us to see.....
If Daily chart can deliver the outcome, they use it.. If Weekly chart can show something they use Weekly chart..
If non of them qualifies for a proper outpout, they use monthly chart
And see that their lines are mostly getting angled, trend lines show near perfection.. But - in reality even a channel wont be perfect or a flag wont be a flag. There will be days shares violate channel rules and come back..
Anyways.. I dont use DFN charts anymore.. I update amibroker even with busyness. But thanks to Sriranga's blog now I dont have to fear losing EOD data for couple of days
_________________
I take risks as a Trader and I select stocks based on Tech and daily Cash in/out. Therefore, my methods may not suit u.. so DYO analysis before making any decisions.
NC`- Top contributor
- Posts : 163
Join date : 2014-09-27
Thanx SM,
I'm not satisfied either about the DFN. This's just a one. Its lack of push email notification/alerts, Pivot point indicators, crashing and freezing etc and lacking of developers for customize indicators... DFN is still in Stone age, compared to other platforms as brokers hopes.
And I've two brokers and I'm not happy with either any. Its better to update EOD...
However, I'm following Fractal theory. Hence it confirms each others, so it doesn't matter the time frame. I've tried many technical reading aspects in past and neither good as fractals.
I'm not satisfied either about the DFN. This's just a one. Its lack of push email notification/alerts, Pivot point indicators, crashing and freezing etc and lacking of developers for customize indicators...
And I've two brokers and I'm not happy with either any. Its better to update EOD...
However, I'm following Fractal theory. Hence it confirms each others, so it doesn't matter the time frame. I've tried many technical reading aspects in past and neither good as fractals.
NC`- Top contributor
- Posts : 163
Join date : 2014-09-27
How to play chaos game.
This's how Fractals and chaos make extraordinary patterns.
In stock market the difference is, its not symmetric as taken in here such as 50%. Instead, we allow a range 38.2% to 61.8%, due to news/announcements and humans behaviors etc...
This's how Fractals and chaos make extraordinary patterns.
In stock market the difference is, its not symmetric as taken in here such as 50%. Instead, we allow a range 38.2% to 61.8%, due to news/announcements and humans behaviors etc...
Backstage- Top contributor
- Posts : 3803
Join date : 2014-02-24
Thanks. Interested to know more.
NC`- Top contributor
- Posts : 163
Join date : 2014-09-27
Here's some basics of fractals relating to equity market..
You can find out more complex with mathematical models over the internet, if you're more familiar with mathematics..
Here's just a one..
However, to its best to know properly the baisc of the Fractals, chaotic, Elliotwave/Harmonic patterns... and keep it simple.
Hope would help..
You can find out more complex with mathematical models over the internet, if you're more familiar with mathematics..
Here's just a one..
However, to its best to know properly the baisc of the Fractals, chaotic, Elliotwave/Harmonic patterns... and keep it simple.
Hope would help..
Backstage- Top contributor
- Posts : 3803
Join date : 2014-02-24
Fascinating, thanks.

nihal123- Top contributor
- Posts : 6327
Join date : 2014-02-24
Age : 58
Location : Waga
Thanks NC
» CCS.N0000 ( Ceylon Cold Stores)
» Sri Lanka plans to allow tourists from August, no mandatory quarantine
» When Will It Be Safe To Invest In The Stock Market Again?
» Dividend Announcements
» MAINTENANCE NOTICE / නඩත්තු දැනුම්දීම
» ඩොලර් මිලියනයක මුදල් සම්මානයක් සහ “ෆීල්ඩ්ස් පදක්කම” පිළිගැනීම ප්රතික්ෂේප කළ ගණිතඥයා
» SEYB.N0000 (Seylan Bank PLC)
» Here's what blind prophet Baba Vanga predicted for 2016 and beyond: It's not good
» The Korean Way !
» In the Meantime Within Our Shores!
» What is Known as Dementia?
» SRI LANKA TELECOM PLC (SLTL.N0000)
» THE LANKA HOSPITALS CORPORATION PLC (LHCL.N0000)
» Equinox ( වසන්ත විෂුවය ) !
» COMB.N0000 (Commercial Bank of Ceylon PLC)
» REXP.N0000 (Richard Pieris Exports PLC)
» RICH.N0000 (Richard Pieris and Company PLC)
» Do You Have Computer Vision Syndrome?
» LAXAPANA BATTERIES PLC (LITE.N0000)
» What a Bank Run ?
» 104 Technical trading experiments by HUNTER
» GLAS.N0000 (Piramal Glass Ceylon PLC)
» Cboe Volatility Index
» AHPL.N0000
» TJL.N0000 (Tee Jey Lanka PLC.)
» CTBL.N0000 ( CEYLON TEA BROKERS PLC)
» COMMERCIAL DEVELOPMENT COMPANY PLC (COMD. N.0000))
» Bitcoin and Cryptocurrency
» CSD.N0000 (Seylan Developments PLC)
» PLC.N0000 (People's Leasing and Finance PLC)
» Bakery Products ?
» NTB.N0000 (Nations Trust Bank PLC)
» Going South
» When Seagulls Follow the Trawler
» Re-activating
» අපි තමයි හොඳටම කරේ !
» මේ අර් බුධය කිසිසේත්ම මා විසින් නිර්මාණය කල එකක් නොවේ
» SAMP.N0000 (Sampath Bank PLC)
» APLA.N0000 (ACL Plastics PLC)
» AVOID FALLING INTO ALLURING WEEKEND FAMILY PACKAGES.
» Banks, Finance & Insurance Sector Chart
» VPEL.N0000 (Vallibel Power Erathna PLC)
» DEADLY COCKTAIL OF ISLAND MENTALITY AND PARANOID PERSONALITY DISORDER MIX.
» WATA - Watawala
» KFP.N0000(Keels Food Products PLC)
» Capital Trust Broker in difficulty?
» IS PIRATING INTELLECTUAL PROPERTY A BOON OR BANE?
» What Industry Would You Choose to Focus?
» Should I Stick Around, or Should I Follow Others' Lead?