
 Home
HomeTrading Journal
+22
Topcat
sanjulanka
lanka
PANTOMATH
Brave Heart
nihal123
serene
First Guy
007
yellow knife
කිත්සිරි ද සිල්වා
roshana7549
blacknights
Future123
jack18
Axe
Backstage
CK
slstock
pathfinder
Yin-Yang
xmart
26 posters

 Yin-Yang
- Posts : 1321
Join date : 2016-03-12
Re: Trading Journal
Fri Sep 23, 2016 9:11 pm
Elliott waves may sometimes coincide with business growth phases; but the two, better not be taken together.
The basis of Elliott waves is psychological [not business performance].
And it is, just like Fib levels, observable in natural movements as well.
For example; you may have heard what happened when the tsunami took place. There were approximately 3 waves; first one small, second one big and so on.
During an earthquake also they say, you can experience a series of quakes.
After all, there are only minor differences between the behavioral patterns of a mass of water, a mass of soil and a mass of Homo sapience.
 007
007- Posts : 159
Join date : 2014-11-29
Re: Trading Journal
Fri Sep 23, 2016 10:46 pm
dear yin yang
i just use the Elliott wave to illustrate the strategy as the discussion start with the Elliott wave .The idea is originally built on the idea of EARNING MATURATION CYCLE check the YK's post for reference YK also tells its looks like product maturation cycle.that is also not a coincident there is no wonder companies earnings follows the same path the product travel as companies profitability depends on product .then the price also have to travel on the same path of course its depends on investors mind investors cant resists the urge to buy the companies that gives continues earning surprises. investor can resist up to some time but cant resist after a specific point thats why we use the technical to identify that specific point thats way this strategy called specific entry point analysis
do know the history of this techniques
SEPA developed from rigorous research decades of application in the real world and observed facts not personal opinions
neither i or mark minervini simply accept this strategy
he also develop this upgraded version after reading several successful investors
including william o nail who is the founder of CAN SLIM.how many of you know william o nail is founder of cup with handle pattern as well .initial history began in 1907 with jesse livermore the greatest trader ever .he made 3million in a single day .even in the 1929 great crash (if some one read stocks for long run will understand what is great crash means even the famous Irving Fisher went bankrupt during this great crash)livermore made a whopping 100 million .from one market professor to next lessons were consistent the basics what make the super performance stock in the past had not changed
 xmartTop contributor
- Posts : 732
Join date : 2015-01-17
Re: Trading Journal
Mon Oct 03, 2016 10:07 am
xmart wrote:
we may expect MT support to hold for now. 6680-6700 will provide some good fight for bull (0.5 fib) and it is essential ASI to break above 6700 to stay in bull trend. if rejected 6400, 6250 will provide some support, but highly unlikely with given market sentiment and September results. in a nutshell, i am expecting a super September.
good luck all!

well, our Elliot pattern broke where wave 3 wasn't strong enough to break the high made by wave 01. this is why i mentioned breaking of wave 01 high from wave 3 as the safest entry.
anyway, its a new month and lets look at the chart.
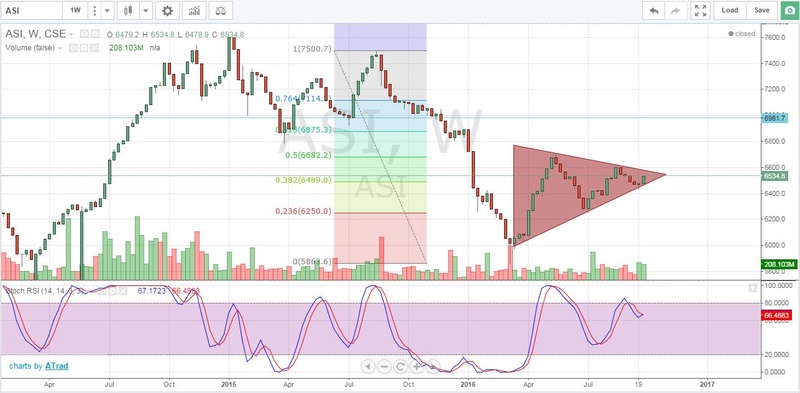
as we can see here, bulls and bears are fighting equally and that have created a symmetrical triangle, which is non-directional pattern. but breaking of the triangle would lead to a new trend.
breaking of 6600 would trigger the target of 6880 and 7100 respectively.
breaking of 6380 would trigger the targets of 6250 and 6000.
anyway, believing the MT support to hold, i expect the ASI to break upward.
good luck all!
- Yin-Yang
- Posts : 1321
Join date : 2016-03-12
Re: Trading Journal
Mon Oct 03, 2016 10:16 am
Why traders always limit themselves to triangles and boxes?
Can't they make use of other polygons such as pentagons, hexagons, heptagons + + +
Can't they make use of other polygons such as pentagons, hexagons, heptagons + + +
- xmartTop contributor
- Posts : 732
Join date : 2015-01-17
Re: Trading Journal
Mon Oct 03, 2016 10:28 am
since we have talked about ACME, i think it is better to give an early warning,
here is the latest chart ACME
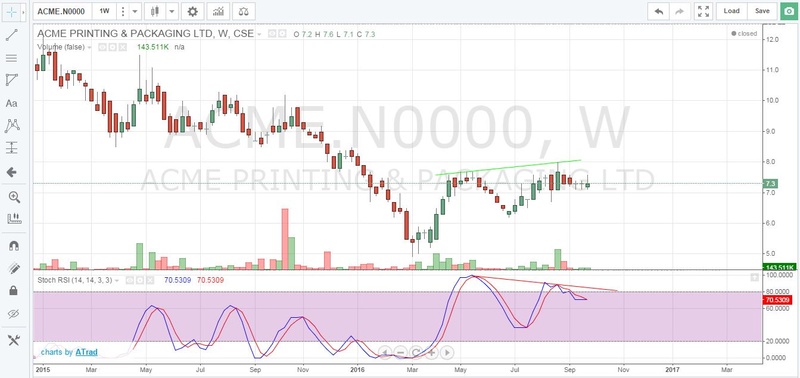
we can see a bearish divergence occurring in weekly chart. if you are short term and with profit, it is better to exit. if you are short term and with loss, wait till the stop loss trigger. if you have collected on purpose, then ignore the trend.
cheer!
xmart wrote:axe,
still the pattern is too early to be ascending triangle. this could take many forms. the good news is ACME had come out from MT resistance trend. making that "W" with a higher low after a downtrend is a good reversal point.
there is a big resistance at 8.80-9.00 range. breaking above 8 will trigger the target of 8.80-9.00 range. furthermore, each stock has its unique way. if you carefully look at weekly candlestick chart you may see dojis at start and end point of each rally.
CCI gave a buy signal at 7.60-7.80 level (22.08.2016) after 28.04.2014. which cannot be ignored very easily (for me)
on financial note:
this is still a loss making company. they went through a restructuring process, change management and reduced loss very well. if they produce a positive earning this will appreciate more. if they fail to return 'from loss making territory, then this technical rally might not sustained and may return to 6.5 level.
good luck.
P:S- i have collected this share from 6 to 6.60 averaging 6.20. my view might be bias but tried to give a balance view.
here is the latest chart ACME
we can see a bearish divergence occurring in weekly chart. if you are short term and with profit, it is better to exit. if you are short term and with loss, wait till the stop loss trigger. if you have collected on purpose, then ignore the trend.
cheer!
- Yin-Yang
- Posts : 1321
Join date : 2016-03-12
Re: Trading Journal
Mon Oct 03, 2016 10:52 am
For educational purposes:
Has 'breaking of wave 01 high from wave 3' occurred in ACME ?
Has 'breaking of wave 01 high from wave 3' occurred in ACME ?
 Axe
Axe- Posts : 251
Join date : 2014-02-23
Re: Trading Journal
Mon Oct 03, 2016 7:49 pm
Thanks Xmart.. I'm currently in profit, but wasn't aware of this development. I'll need to see what I should do. Thanks again.
But, won't an upward movement in ASI have some support for ACME?
But, won't an upward movement in ASI have some support for ACME?
- xmartTop contributor
- Posts : 732
Join date : 2015-01-17
Re: Trading Journal
Thu Oct 25, 2018 9:04 pm
Yin-Yang wrote:For educational purposes:
Has 'breaking of wave 01 high from wave 3' occurred in ACME ?
that is called a fakeout my friend as you well know that. The market is a treacherous girlfriend who shows you one face and next step changes it something different. what we are trying to do is make a logical and systematic approach to understand the behavior of each stock as per their post behaviors. since chart patterns also vary with stock to stock with attracted holders.
sorry that I took 2 years to reply that.
- xmartTop contributor
- Posts : 732
Join date : 2015-01-17
Re: Trading Journal
Thu Oct 25, 2018 9:56 pm
REXP

There is an interesting chart again. REXP has been on the downward channel since 2016 and indicators show that turnover occurred at 160 level. a breaking of 200 psychological barrier would ensure that down trend has also come to an end.
the breaking of 200 would open possibilities to test the immediate resistance of 220, then 245 and 265 in the coming months if the trend is strong. fundamentally if REXP could earn 50+ EPS with favorable exchange fluctuation, GSP+ etc.
BFL
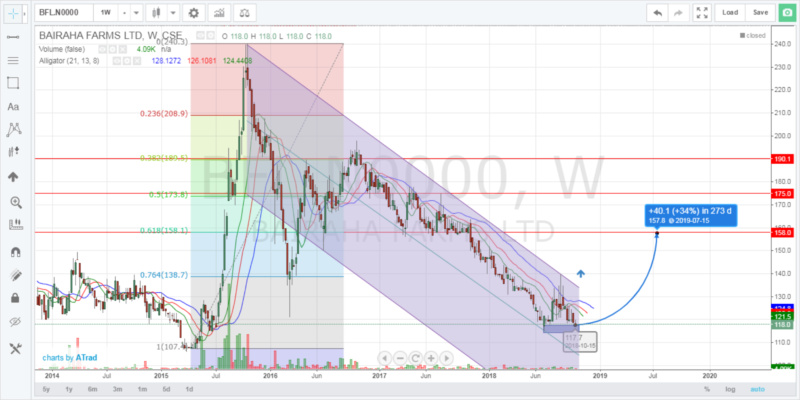
Technically, BFL is forming a double bottom in the weekly chart around strong support area 115. given policy decision on maize importation, it is not possible to expect big appreciation in share price but forming of the double bottom would take BFL to 155-160 region for consolidation.
SAMP
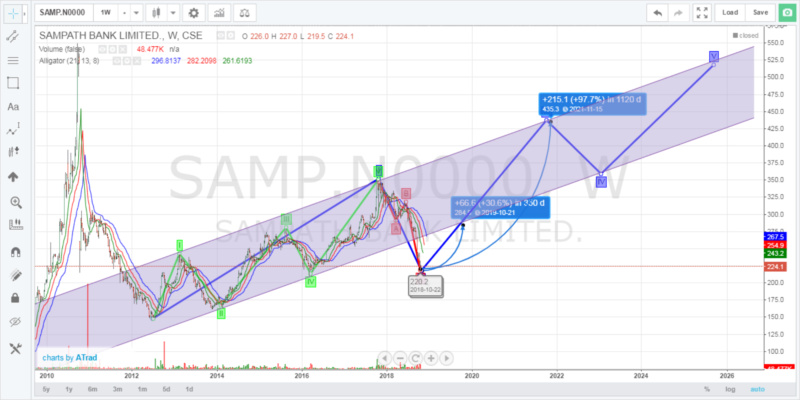
classic chart for classic share. SAMP has completed it's 5 waves in complete Elliot cycles from 2012-2018 period in another major Elliot wave (Wave I) and then looking forward to start its 2nd wave to 450+ in 4-5 years. but excessive correction had brought the share below to 220 which is discounted since technically bottom could have been around 250.
deeper the correction, swifter the wave! so, this share probably corrected to 275-280 level once the market base established.
SCAP
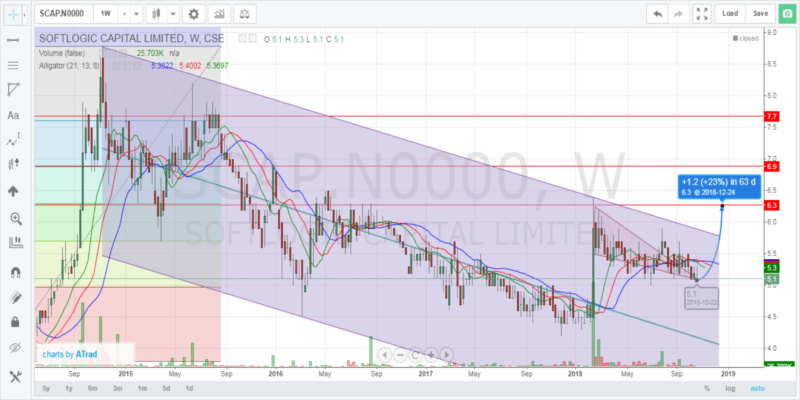
interesting chart for failing wedge bullish continuation. testing of psychological barrier 6 in coming days is an inevitable and likely breaking of 6 to test 6.3 would bring 20% capital return and nearly 8-10% dividend gain. if 6.3 resistance broke successfully with the failing wedge, we could expect SCAP to test 7.50 -7.70 in coming months.
open for discussion! please..
 sereneTop contributor
- Posts : 4850
Join date : 2014-02-26
Re: Trading Journal
Fri Oct 26, 2018 5:39 am
Thanks X..
 nihal123Top contributor
- Posts : 6327
Join date : 2014-02-24
Age : 58
Location : Waga
Re: Trading Journal
Fri Oct 26, 2018 6:34 am
Thanks xmart
- Brave Heart
- Posts : 171
Join date : 2018-10-17
Re: Trading Journal
Fri Oct 26, 2018 7:11 am
Thanks X really good work. I have to agree with u with regard to Sampath as it was subject to over correction. I do expect 250/- will be the reasonable base for it to stabilise given the current market context.
+ rep from me
+ rep from me
 PANTOMATH
- Posts : 231
Join date : 2018-10-15
Re: Trading Journal
Fri Oct 26, 2018 8:47 am
Thanks XM for the presentation.
REXP is good as Longterm investment.I pointed out it in REXP thread as well.
If you are a longterm trader weekly chart is not the ideal chart format.If you carefully looked at your chart in 2017 May also REXP has shown the same chart pattern in weekly chart.But it failed in few weeks.
I use quarterly chart for longterm trading. REXP is now positive in quarterly charts that's why I mentioned it in REXP thread.
I'll discuss about LT trading later.
- yellow knifeTop contributor
- Posts : 6980
Join date : 2014-03-27
Re: Trading Journal
Fri Oct 26, 2018 8:59 am
Thanks X
- Brave Heart
- Posts : 171
Join date : 2018-10-17
Re: Trading Journal
Fri Oct 26, 2018 9:03 am
Yes quarterly charts are better for long term decisionsPANTOMATH wrote:Thanks XM for the presentation.
REXP is good as Longterm investment.I pointed out it in REXP thread as well.
If you are a longterm trader weekly chart is not the ideal chart format.If you carefully looked at your chart in 2017 May also REXP has shown the same chart pattern in weekly chart.But it failed in few weeks.
I use quarterly chart for longterm trading. REXP is now positive in quarterly charts that's why I mentioned it in REXP thread.
I'll discuss about LT trading later.
- xmartTop contributor
- Posts : 732
Join date : 2015-01-17
Re: Trading Journal
Fri Oct 26, 2018 4:54 pm
Thanks All,
well Panto, my trading horizon is 1-3 years most. therefore I usually prefer weekly charts for patterns, setups and use monthly charts to identify prevailing trends as CSE is illiquid to go below weekly charts and not matured market for rely on much higher time frames like monthly or quarterly.
anyway, we are waiting for your knowledge sharing on long term trading in CSE.
thanks
P:S- Market is active again. we'll see how things are going to unfold.
- Brave Heart
- Posts : 171
Join date : 2018-10-17
Re: Trading Journal
Fri Oct 26, 2018 6:04 pm
Thanks X. Market is active means market is recovering thanks to JKH. JKH pulled down the market and similarly JKH itself should lift the market as well.
- xmartTop contributor
- Posts : 732
Join date : 2015-01-17
Re: Trading Journal
Mon Dec 03, 2018 11:27 am
Quick Recap.
REXP has entered to bullish territory again with breaking of 200. currently testing 220 level resistance and can be expected a minor pullback up to 210. then probably next testing point would be 245-250 probably within this month.
BFL is nicely consolidating around the bottom after rejection at 130 level. anytime soon this shall be reach 160 level for next consolidation.
SAMP is continuing its legacy toward 250 region as expected.
SCAP, my special share at that moment. talked at 4.90-5.10 region and today it tested 6. since healthy dividend can be expected from this time around touching of 6.30- 6.50 is inevitable but entering now would not be prudent as SCAP has been heated up a lot.
cheer!
xmart wrote:REXP
There is an interesting chart again. REXP has been on the downward channel since 2016 and indicators show that turnover occurred at 160 level. a breaking of 200 psychological barrier would ensure that down trend has also come to an end.
the breaking of 200 would open possibilities to test the immediate resistance of 220, then 245 and 265 in the coming months if the trend is strong. fundamentally if REXP could earn 50+ EPS with favorable exchange fluctuation, GSP+ etc.
BFL
Technically, BFL is forming a double bottom in the weekly chart around strong support area 115. given policy decision on maize importation, it is not possible to expect big appreciation in share price but forming of the double bottom would take BFL to 155-160 region for consolidation.
SAMP
classic chart for classic share. SAMP has completed it's 5 waves in complete Elliot cycles from 2012-2018 period in another major Elliot wave (Wave I) and then looking forward to start its 2nd wave to 450+ in 4-5 years. but excessive correction had brought the share below to 220 which is discounted since technically bottom could have been around 250.
deeper the correction, swifter the wave! so, this share probably corrected to 275-280 level once the market base established.
SCAP
interesting chart for failing wedge bullish continuation. testing of psychological barrier 6 in coming days is an inevitable and likely breaking of 6 to test 6.3 would bring 20% capital return and nearly 8-10% dividend gain. if 6.3 resistance broke successfully with the failing wedge, we could expect SCAP to test 7.50 -7.70 in coming months.
open for discussion! please..
- xmartTop contributor
- Posts : 732
Join date : 2015-01-17
Re: Trading Journal
Wed Dec 19, 2018 6:48 pm
a quick recap on last sticks
REXP:
expected pullback toward 200-210 happened. now this will consolidate bit more. if base formed above 200, the bullish move can be sooner than expected. 250 will be visible once ASI finds support and direction once political stability established. can be classified as buy as of now.
SCAP:
done well. touched 6.30. all depend on the expected dividend. if a dividend is considerable with given one-off gain from AAIC this can break 6.30 and go bit further. this is in hold territory, not in buy territory.
SAMP & BFL:
nothing to worry. both are following trend suit as discussed earlier. BFL to cover the ground more.
GREG:

well, I was trading GREG from 11-11.50 a while. did not post since it was just a minor 3% gain. but there is a bigger play here. we could expect 20% gain once the price breaks out from the consolidation box. according to falling volume and rising OBV, we could expect Greg to jump high once overall market finds a base. since Greg is now sitting at the bottom of the consolidation box, we are at high probability of winning a trade. on the contrary, if GREG goes south, stop loss shall be below 10.
- nihal123Top contributor
- Posts : 6327
Join date : 2014-02-24
Age : 58
Location : Waga
Re: Trading Journal
Wed Dec 19, 2018 8:27 pm
Thanks xmart
- PANTOMATH
- Posts : 231
Join date : 2018-10-15
Re: Trading Journal
Sat Dec 22, 2018 11:11 am
Thanks X mart,
USD/LKR resumes it's journey toward 200,If you calculate currency gain alone of REXP, without considering revenue growth even,numbers would make your jaw drop.
REXP is in a LT up trend,These pull backs are small correcting waves of a bigger up wave,REXP should hit 300 sooner than later with next reports.Investors should hold on,traders can ride on mini waves.
Agree with XM,Any subtle movement of ASI create considerable move on JUNKS like GREG,TFC,ACME,BLUE,TESS,buyng those at support can certainly give more than 10% in a slight ASI movement as their beta value against ASI is considerably high.
- xmartTop contributor
- Posts : 732
Join date : 2015-01-17
Re: Trading Journal
Sat Jan 19, 2019 6:16 pm
SCAP is done. REXP, BFL, and SAMP are still on the move. so let's look at any new bullish entries while our winnings run.
how about,
1. MGT
2. ASIY
3. APLA
4. TYRE
shall we discuss them?
how about,
1. MGT
2. ASIY
3. APLA
4. TYRE
shall we discuss them?
- sereneTop contributor
- Posts : 4850
Join date : 2014-02-26
Re: Trading Journal
Sat Jan 19, 2019 9:48 pm
xmart wrote:SCAP is done. REXP, BFL, and SAMP are still on the move. so let's look at any new bullish entries while our winnings run.
how about,
1. MGT
2. ASIY
3. APLA
4. TYRE
shall we discuss them?
Yes, Of Course X.
1.MGT - Struggling Break Rs.10 Resistance but with the Better Apparel Quarter; being at the right end of RS / $ battle ; Better Interim Result might give energy to break the Rs.10 Resistance.
2.ASIY - Seesawing Rs.2 to Rs.2.10 for a longer time frame that is too long for a some ones liking.
3.APLA - Seems to be at the end of long Bearish trend which plummeted Share price Rs.230/= to Rs.70/= which is fueled by very weak Last quarter. This Quarter would be pivotal to change the direction.
4.TYRE -Which also seems to be at the end of long bearish trend which affected price to be dropped from Rs.80/= to Rs.30's/=.
One common feature for all the shares is that all of are looking to end their long bearish trends and all must come up a solid results to do that.
X What about HSIG / HEXP / GHLL /AHUN / ARPI and Plantations Like LDEV / MAL /MASK.
Permissions in this forum:
You cannot reply to topics in this forum