
 Home
HomeTJL Chart- - - 02-05-2014
+5
Ethical Trader
iham77
Nuinth
කිත්සිරි ද සිල්වා
SRIAS
9 posters

 SRIAS
SRIAS- Posts : 18
Join date : 2014-05-02
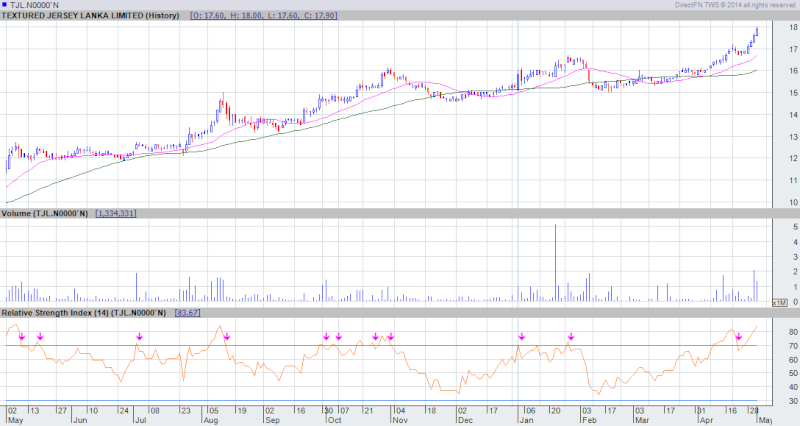
TJL Chart- - - 02-05-2014
Fri May 02, 2014 10:07 pm
More on
http://sriastechnical.blogspot.com/2014/05/tjl-chart-02-05-2014.html
 කිත්සිරි ද සිල්වාTop contributor
- Posts : 9679
Join date : 2014-02-23
Age : 66
Location : රජ්ගම
Re: TJL Chart- - - 02-05-2014
Fri May 02, 2014 10:11 pm
RSI above 70.
Does that means Get out ?
Does that means Get out ?
- SRIAS
- Posts : 18
Join date : 2014-05-02
Re: TJL Chart- - - 02-05-2014
Fri May 02, 2014 10:16 pm
කිත්සිරි ද සිල්වා wrote:RSI above 70.
Does that means Get out ?
overbought is used to describe a share price that has advanced to a point at which, historically, it has tended to reverse and move lower.
- NuinthTop contributor
- Posts : 555
Join date : 2014-02-28
Location : Universe
Re: TJL Chart- - - 02-05-2014
Sat May 03, 2014 1:05 pm
Thx SRIAS.
Guess still trend is good with strong buying. But better to keep in touch with market movements.
Guess still trend is good with strong buying. But better to keep in touch with market movements.
- කිත්සිරි ද සිල්වාTop contributor
- Posts : 9679
Join date : 2014-02-23
Age : 66
Location : රජ්ගම
Re: TJL Chart- - - 02-05-2014
Sat May 03, 2014 6:21 pm
I just looked at the RSI on Direct FN and it shows 53.91.
Wondering which one is accurate as the this shows downward trend already.
Can someone enlighten us here please?
Wondering which one is accurate as the this shows downward trend already.
Can someone enlighten us here please?
- කිත්සිරි ද සිල්වාTop contributor
- Posts : 9679
Join date : 2014-02-23
Age : 66
Location : රජ්ගම
Re: TJL Chart- - - 02-05-2014
Sat May 03, 2014 9:45 pm
 " />
" />- iham77
- Posts : 9
Join date : 2014-02-27
Re: TJL Chart- - - 02-05-2014
Sat May 03, 2014 10:00 pm
My direct fn shows 78.16 
- කිත්සිරි ද සිල්වාTop contributor
- Posts : 9679
Join date : 2014-02-23
Age : 66
Location : රජ්ගම
Re: TJL Chart- - - 02-05-2014
Sat May 03, 2014 10:04 pm
So, which is to be taken as correct and is there any other source that we can verify this?
iham77 wrote:My direct fn shows 78.16
 Ethical TraderTop contributor
- Posts : 5568
Join date : 2014-02-28
Re: TJL Chart- - - 02-05-2014
Sun May 04, 2014 11:58 am
I think all these readings depends on your individual settings of the chart. If you have different settings you get different readings. Best thing is to consult the IT ppl of your broker.
- SRIAS
- Posts : 18
Join date : 2014-05-02
Re: TJL Chart- - - 02-05-2014
Sun May 04, 2014 1:45 pm
කිත්සිරි ද සිල්වා wrote:
කිත්සිරි ද සිල්වා RSI normally calculated by period of 14.
When your checking with 6 days chart u will get different figure.
RSI figure will change for daily,weekly,monthly and yearly chart.
 Lux2014
- Posts : 172
Join date : 2014-03-29
Location : Colombo
Re: TJL Chart- - - 02-05-2014
Sun May 04, 2014 3:54 pm
SRIAS wrote:කිත්සිරි ද සිල්වා wrote:RSI above 70.
Does that means Get out ?
overbought is used to describe a share price that has advanced to a point at which, historically, it has tended to reverse and move lower.
Please correct me, if I'm wrong.
I have read somewhere that we can afford to ignore an over-bought situation to some extent, when there is a clear bullish trend for the stock. I assume TJL is on an uptrend as it has achieved a high recently.
- Ethical TraderTop contributor
- Posts : 5568
Join date : 2014-02-28
Re: TJL Chart- - - 02-05-2014
Sun May 04, 2014 4:27 pm
You are absolutly correct, because RSI is only a tool which uses past data. It canot read the future or general investor sentiment. All technical tools give signals but we must be able to use them with other background data and general investor sentiments. Tools are usefull but we should not blindly follow them.Lux2014 wrote:SRIAS wrote:කිත්සිරි ද සිල්වා wrote:RSI above 70.
Does that means Get out ?
overbought is used to describe a share price that has advanced to a point at which, historically, it has tended to reverse and move lower.
Please correct me, if I'm wrong.
I have read somewhere that we can afford to ignore an over-bought situation to some extent, when there is a clear bullish trend for the stock. I assume TJL is on an uptrend as it has achieved a high recently.
- SRIAS
- Posts : 18
Join date : 2014-05-02
Re: TJL Chart- - - 02-05-2014
Sun May 04, 2014 5:49 pm
Lux2014 wrote:SRIAS wrote:කිත්සිරි ද සිල්වා wrote:RSI above 70.
Does that means Get out ?
overbought is used to describe a share price that has advanced to a point at which, historically, it has tended to reverse and move lower.
Please correct me, if I'm wrong.
I have read somewhere that we can afford to ignore an over-bought situation to some extent, when there is a clear bullish trend for the stock. I assume TJL is on an uptrend as it has achieved a high recently.
Lux2014 I just gave my prediction.
I also mention there "If the volume reduce in coming days pull back will occur."
- Ethical TraderTop contributor
- Posts : 5568
Join date : 2014-02-28
Re: TJL Chart- - - 02-05-2014
Sun May 04, 2014 6:04 pm
http://investorsentiment.forumotion.net/t645-11-rules-for-anyone-who-uses-charts#3406
- Lux2014
- Posts : 172
Join date : 2014-03-29
Location : Colombo
Re: TJL Chart- - - 02-05-2014
Sun May 04, 2014 7:23 pm
Mr Srias,
Thank you for your input.
If this is not a tall order, can I ask you this pl? -- If volumes hold, how high can we expect TJL to go?
Thank you for your input.
If this is not a tall order, can I ask you this pl? -- If volumes hold, how high can we expect TJL to go?
- marusira
- Posts : 138
Join date : 2014-02-23
Re: TJL Chart- - - 02-05-2014
Sun May 04, 2014 7:27 pm
18.50-19Lux2014 wrote:Mr Srias,
Thank you for your input.
If this is not a tall order, can I ask you this pl? -- If volumes hold, how high can we expect TJL to go?
- SRIAS
- Posts : 18
Join date : 2014-05-02
Re: TJL Chart- - - 02-05-2014
Sun May 04, 2014 8:05 pm
Lux2014 wrote:Mr Srias,
Thank you for your input.
If this is not a tall order, can I ask you this pl? -- If volumes hold, how high can we expect TJL to go?
If volume maintain close to 1.5 mn each trading day,Stock can go Rs.2 up from current point.
- Lux2014
- Posts : 172
Join date : 2014-03-29
Location : Colombo
Re: TJL Chart- - - 02-05-2014
Sun May 04, 2014 8:28 pm
Thanks a lot Mr SRIAS and Mr Marusira.
- CSE.SAS
- Posts : 263
Join date : 2014-02-23
Re: TJL Chart- - - 02-05-2014
Sun May 04, 2014 9:43 pm
SRIAS wrote:Lux2014 wrote:Mr Srias,
Thank you for your input.
If this is not a tall order, can I ask you this pl? -- If volumes hold, how high can we expect TJL to go?
If volume maintain close to 1.5 mn each trading day,Stock can go Rs.2 up from current point.
I don't think TJL can go Rs.2 more.
- Lux2014
- Posts : 172
Join date : 2014-03-29
Location : Colombo
Re: TJL Chart- - - 02-05-2014
Mon May 05, 2014 7:53 am
Another "community driven site" has predicted TJL to go up to 25/=.
 BackstageTop contributor
- Posts : 3803
Join date : 2014-02-24
Re: TJL Chart- - - 02-05-2014
Mon May 05, 2014 1:09 pm
Lux2014 wrote:Another "community driven site" has predicted TJL to go up to 25/=.
Is it a "commu-nuty " driven site ?
- CSE.SAS
- Posts : 263
Join date : 2014-02-23
Re: TJL Chart- - - 02-05-2014
Mon May 05, 2014 2:59 pm
SRIAS wrote:Lux2014 wrote:Mr Srias,
Thank you for your input.
If this is not a tall order, can I ask you this pl? -- If volumes hold, how high can we expect TJL to go?
If volume maintain close to 1.5 mn each trading day,Stock can go Rs.2 up from current point.
SRIAS as you said TJL had 2.9 million volume and price touched 19 rupees
- CSE.SAS
- Posts : 263
Join date : 2014-02-23
Re: TJL Chart- - - 02-05-2014
Wed May 07, 2014 11:09 am
Some one manipulating the TJL oder book.
Around 10 am only 143,00 buyer
In 5 mins following buyer came at following pricce.
250,000 @ Rs.18.50
100,000 @ Rs.18.30
100,000 @ Rs.18.30
and
200,000 @ Rs.18.00.
Be aware of this stock.
Around 10 am only 143,00 buyer
In 5 mins following buyer came at following pricce.
250,000 @ Rs.18.50
100,000 @ Rs.18.30
100,000 @ Rs.18.30
and
200,000 @ Rs.18.00.
Be aware of this stock.
- Lux2014
- Posts : 172
Join date : 2014-03-29
Location : Colombo
Re: TJL Chart- - - 02-05-2014
Wed May 07, 2014 6:02 pm
What could be their intention? To drive it down?
- CSE.SAS
- Posts : 263
Join date : 2014-02-23
Re: TJL Chart- - - 02-05-2014
Thu May 08, 2014 10:03 am
Lux2014 wrote:What could be their intention? To drive it down?
now see the TJL order book.
Permissions in this forum:
You cannot reply to topics in this forum